The National Waste Report, released every two years, provides a snapshot of Australia’s waste generation and management, including who is responsible for the waste and how much of it is recycled. The latest report was released late last year and provides data from financial year 2020-21.
Here are some of the key findings:
Recycling is improving – Australia’s recycling rate has increased by 57% over the last 15 years.
However, the total quantity of waste we are generating is also increasing with our growing population.
From July 2020 to June 2021, Australia generated 75.8 mega tonnes (millions of tonnes) of total waste* – that’s the equivalent weight of 471 Sydney Opera Houses.
We recovered 63% of that waste through recycling, energy from waste, and waste reuse (any kind of waste that is recovered from a landfill for reuse without processing such as items sold in tip shops).
Households and council operations are only responsible for 18% of all waste generated in Australia.
Commercial businesses and industry (C&I) and construction and demolition (C&D) are responsible for the remaining 43% and 38% respectively (including ash generated from coal-powered electricity).
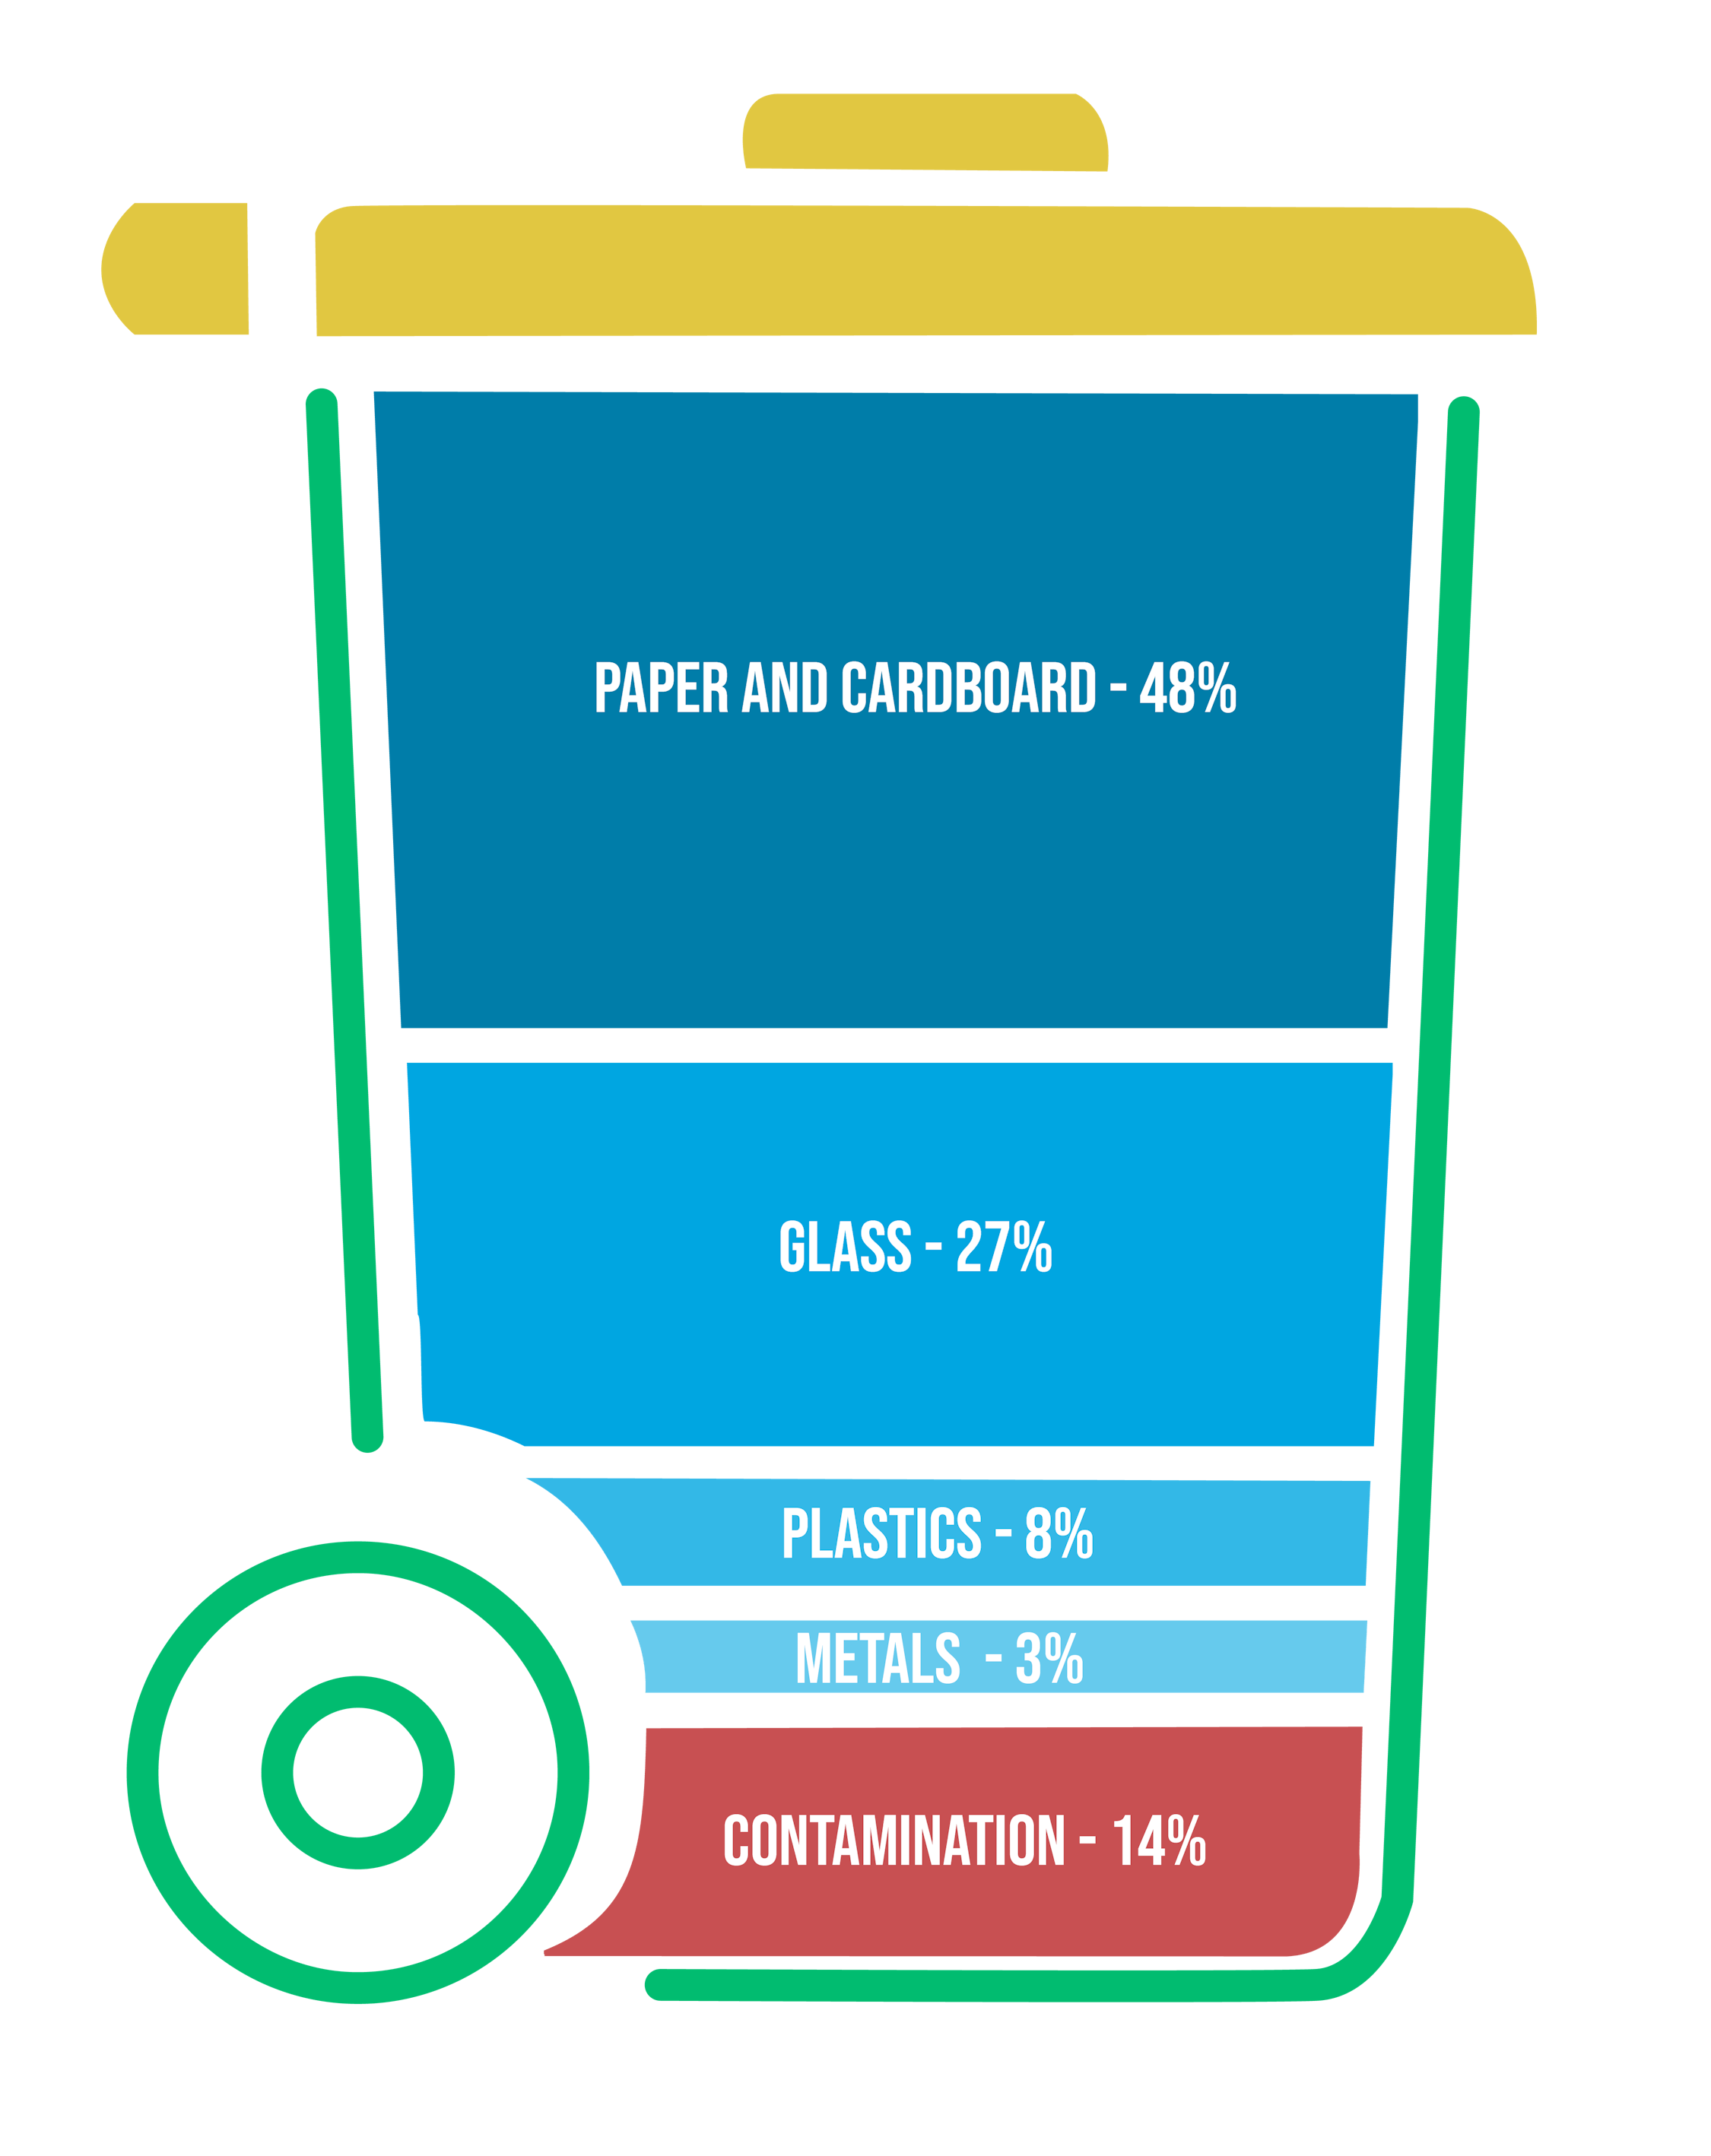
Around 14% of what we’re putting in our recycling bins is classified as ‘contamination’ and can’t be recycled.
We’re very good at recycling certain types of materials like metals (87% of metals were recycled), but we’re not great at recycling plastics (only 13% of plastics were recycled). However, plastics only make up 3% of our total waste by weight.
*Total waste includes municipal (households and council operations), commercial and industry, and construction and demolition waste, including ash generated from coal-powered electricity. The report does not include waste generated from mining, mineral processing, agriculture, fisheries, and sewage.
What happens to our garbage and recycling?
In 2020-21, Australians put 9.7 mega tonnes (Mt) of waste into their garbage, recycling, and organics bins at home. Most of that waste went into garbage bins (almost 68% or 6 Mt), eventually ending up in landfills, with a small portion incinerated without energy recovery. In some states, some of the organics-rich waste that was collected in garbage bins was sent to Mechanical Biological Treatment facilities where valuable materials like metals were extracted from the trash before it was composted and sent to landfill or applied to land.
Most Australians have access to a recycling bin at home (98% of the population), with 79% also provided either a garden organics bin or a food and garden organics (FOGO) bin by their council (sometimes both). In total, 1.8 Mt of recyclables were collected from recycling bins across the country in 2020-21, typically including items such as plastic, paper and glass packaging, steel cans, mixed paper and cardboard, and plastic containers. However, 14% of the waste put in recycling bins was classified as ‘contamination’ and could not be recycled.
Contamination in recycling bins is mostly comprised of items that either should have been put in the garbage bin or require specialised recycling services and equipment (i.e., the recycling plants that receive our recycling are not equipped to process these materials). Common contaminants include soft plastics (plastic items that can easily be scrunched in your hand like chip packets), food, clothing, and bagged recyclables (recycling should always be put in your bin loose). However, broken glass also contributed to contamination as it can degrade the quality of materials like cardboard, and it is also difficult to sort by colour (markets for mixed coloured glass are poor).
Which state has the best recovery rate?
On a national scale, recovery and recycling rates are increasing, growing from 50% in 2006-07 to 63% in 2020-21. But who are the best recyclers among us? South Australia was the highest ranked jurisdiction, with a resource recovery rate of 80% including waste from businesses and construction and demolition. That means only one fifth of the waste generated in South Australia ended up in landfill or was incinerated. South Australia mainly relied on recycling to achieve this recovery rate, with some energy from waste recovery and waste reuse.
Following, in order and with recovery rates in brackets, were the Australian Capital Territory (69%), New South Wales and Victoria (67%), Western Australia (64%), Tasmania (51%), Queensland (47%), and the Northern Territory (19%).
South Australians were also more likely to engage in recycling through Container Deposit Schemes (CDS) – a recycling scheme that accepts certain types of drink containers for a 10c refund to reduce litter and increase recycling of those items. South Australia had an overall return rate of 76% (based on the number of containers returned through CDS compared to the number sold), closely followed by the Northern Territory with a return rate of 72%. These state schemes have been active in both jurisdictions for a long period of time (more than 40 years in South Australia), indicating the longer a scheme has been in place the more likely the public is to engage.
Who is generating the most waste?
When ash from coal-powered electricity generation is included, businesses and industry are creating the most waste in Australia, while also having some of the lowest recovery and recycling rates. The commercial and industrial (C&I) sector was responsible for 43% of all waste generated in 2020-21, and more than half (52%) of the waste that ended up in landfill or was incinerated came from C&I.
Construction and demolition (C&D) followed closely behind, generating 38% of all waste (just 18% of Australia’s total waste came from households and local government activities). However, most of the waste from C&D was made up of building and demolition materials, which has one of the highest recovery rates. Almost 70% of the waste generated by C&D was recycled in 2020-21.